 Tide
Tide

See it
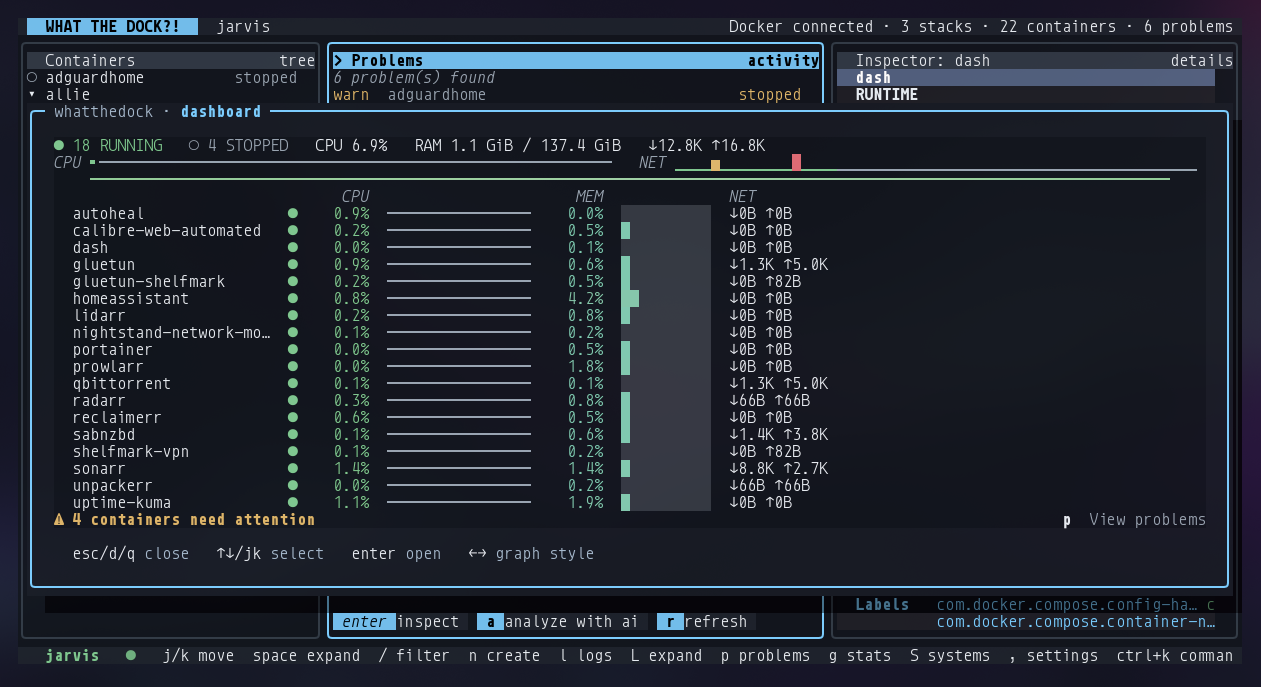
- What's running, at a glanceA fleet summary line, then every container with a status dot and a CPU, memory and network sparkline row.
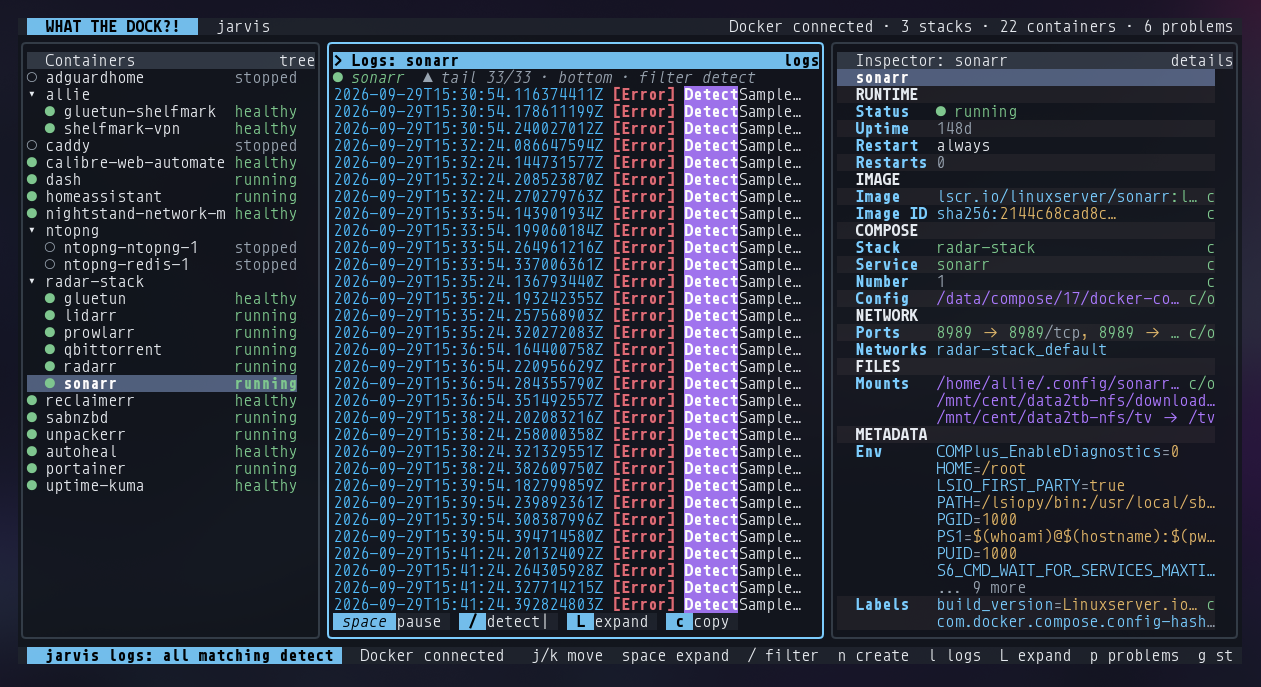
- Colour-coded logs l LFilter to errors, warnings, info or all. Jump to the end and follow live, page back through history, copy the visible lines.
- A problems pane pRestart loops and unhealthy containers surfaced together. Press a to ask a configured AI provider to analyse one.
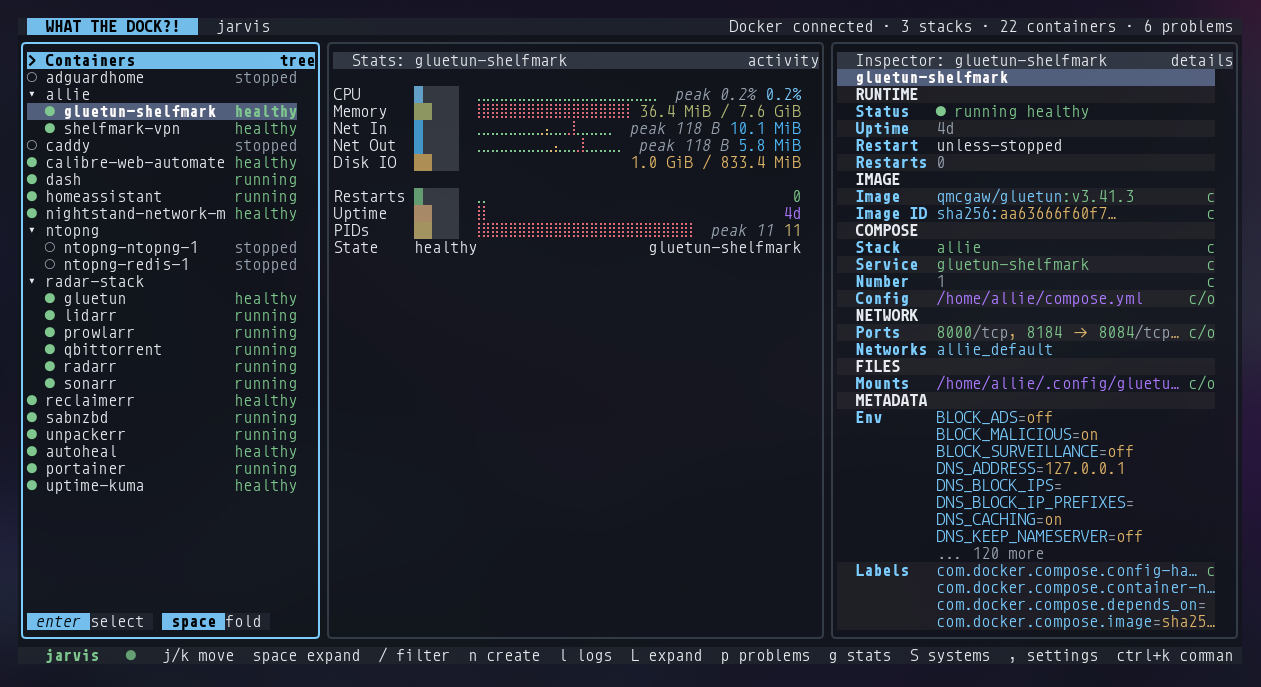
- Stats graphs gCPU, memory and network over time when a sparkline isn't enough.